Technical case study
Startup Revenue Prediction Model
A multiple-linear-regression pipeline predicting startup profit from spending variables and encoded location information.
The problem
This project built a multiple linear regression model to predict startup profitability based on their R&D spending, administration costs, marketing expenditure, and location. I implemented a complete machine learning pipeline using scikit-learn to analyze which factors most strongly influence startup success and revenue generation.
How well can a simple linear model explain startup profit from R&D, administration, marketing and state-level inputs?
Approach
Rather than presenting the project as a notebook dump, this case study focuses on the decisions that shaped the analysis.
- Data import & separation: Loaded the 50 Startups dataset using pd.read_csv() and strategically separated features (X) from the target variable (y) using .iloc[:, -1] for all columns except the last, and .iloc[:, -1] for the dependent variable (profit).
- Categorical Encoding: Applied One-Hot Encoding using ColumnTransformer and OneHotEncoder() to convert the categorical ‘State’ variable (column index [3]) into numerical dummy variables, while keeping other numerical features intact using remainder=‘passthrough’ .
- Data transformation, model training & prediction: Used np.array(ct.fit_transform(X)) to convert the transformed data back into a NumPy array format suitable for machine learning algorithms. Implemented train_test_split() with an 80-20 split (test_size=0.2) and fixed random state (random_state=0) to ensure reproducible results and proper model validation. Instantiated and trained a LinearRegression() model using .fit(X_train, y_train) to learn the relationships between startup characteristics and profitability. Generated predictions on the test set using regressor.predict(X_test) to evaluate model performance on unseen data.
- Results Visualisation: Used np.set_printoptions(precision=2) for clean output formatting and np.concatenate() with reshape() to create side-by-side comparison of predicted vs. actual values for easy performance assessment.
Key implementation decision
Encode the categorical variable without disturbing numerical features
ColumnTransformer lets state be one-hot encoded while the spending variables pass through unchanged. That keeps preprocessing explicit and makes the resulting feature matrix compatible with the regression model.
ct = ColumnTransformer(
    transformers=[("encoder", OneHotEncoder(), [3])],
    remainder="passthrough"
)
X = np.array(ct.fit_transform(X))

X_train, X_test, y_train, y_test = train_test_split(
    X, y, test_size=0.2, random_state=0
)

regressor = LinearRegression()
regressor.fit(X_train, y_train)
y_pred = regressor.predict(X_test)Results & evidence
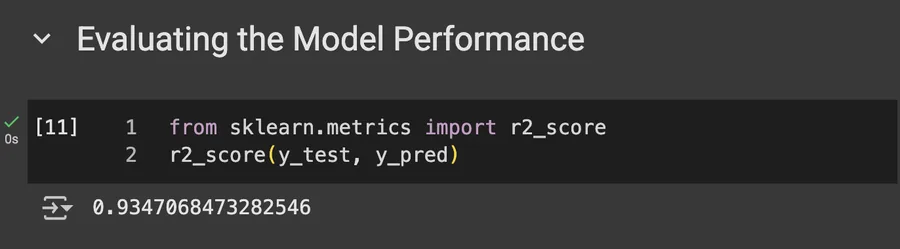
The figures below are the project evidence I would show first. The full implementation remains available through the GitHub link at the top of the page.
What challenged me
The array reshaping and concatenation for results display presented a significant hurdle because the predicted and actual values were 1D arrays that couldn’t be directly concatenated horizontally. The error occurred when trying to use np.concatenate() without proper dimensionality. This was solved by using reshape(len(y_pred),1) to convert both arrays into column vectors (2D arrays with one column), then applying horizontal concatenation with the parameter 1 to stack them side-by-side. This approach created a clean comparison matrix showing predicted values next to actual values, making model performance evaluation much more intuitive.
What I learned
- ColumnTransformer made categorical encoding explicit without rewriting the numerical features.
- Predicted-versus-observed values are easier to interpret when they are placed side by side.
- A linear model is useful as an interpretable baseline, but residual diagnostics are needed before trusting the relationship.
What I would improve next
- Report regression diagnostics and residual behaviour, not only predicted-vs-actual values.
- Test whether the location variable materially improves out-of-sample performance.
- Use cross-validation to reduce dependence on one train/test split.
This is a compact supervised-learning project where the main analytical value is seeing how preprocessing, splitting and prediction fit together in a complete regression workflow.