Technical case study
Portfolio Optimization & Risk Analysis
A portfolio-allocation and risk-analysis exercise using normalised stock prices, random weights, daily returns and the Sharpe ratio.
The problem
This project built a comprehensive portfolio management system that simulates random asset allocation across major stocks and calculates key financial metrics including returns, volatility, and risk-adjusted performance. I developed a complete portfolio analytics framework using Python to evaluate investment strategies and portfolio performance over time.
How can different stock allocations be placed on a common basis and compared using both return and risk-adjusted performance?
Approach
Rather than presenting the project as a notebook dump, this case study focuses on the decisions that shaped the analysis.
- Data Preparation: Loaded and sorted stock data chronologically using sort_values() by Date to ensure proper time series analysis for portfolio calculations.
- Random Portfolio Generation: Used np.random.seed() and np.random.seed(9) to create randomized asset allocation weights, then normalized them using weights / np.sum(weights) to ensure they sum to 100%.
- Portfolio Normalisation: Applied a custom normalize() function to standardize all stock prices to their initial values, creating a baseline for relative performance comparison across different price ranges.
- Portfolio function development: Built a reusable portfolio_allocation() function that encapsulates the entire workflow for testing different weight combinations and portfolio strategies.
- Risk metrics calculation: Computed cumulative return, standard deviation (volatility), average daily return, and Sharpe ratio (assessesment of the risk-adjusted returns of an investment) using np.sqrt(252) for annualization.
Key implementation decision
Normalise prices before applying weights
Raw share prices are not directly comparable across assets. Rebasing every series to its initial value makes each weight operate on relative performance rather than on arbitrary price levels.
weights = np.array(np.random.random(9))
weights = weights / np.sum(weights)

def normalize(df):
    x = df.copy()
    for stock in x.columns[1:]:
        x[stock] = x[stock] / x[stock][0]
    return x

sharpe_ratio = (
    df_portfolio["portfolio daily % return"].mean()
    / df_portfolio["portfolio daily % return"].std()
    * np.sqrt(252)
)Results & evidence
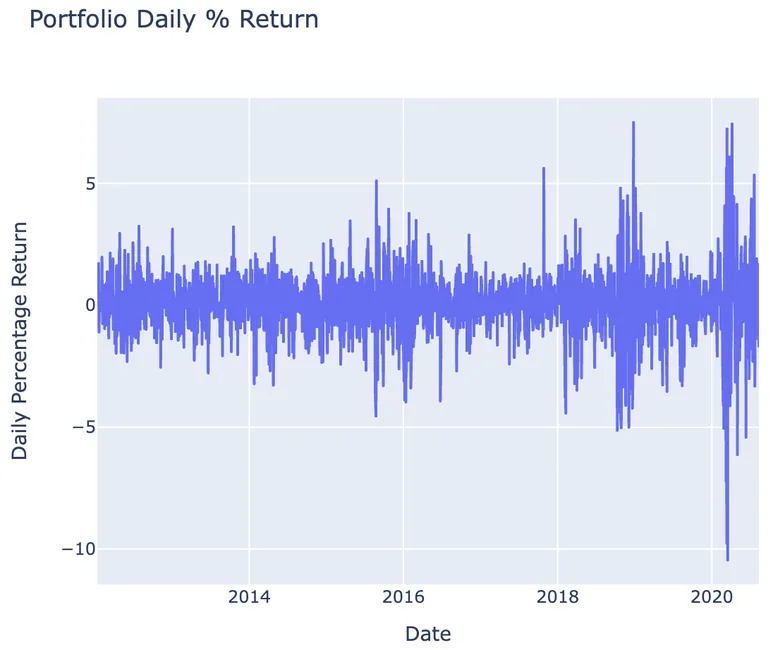
The figures below are the project evidence I would show first. The full implementation remains available through the GitHub link at the top of the page.
What challenged me
I initially encountered an indexing error when calculating portfolio daily returns because I was trying to access the previous day’s value for the first row, which doesn’t exist. The calculation df_portfolio[‘portfolio daily % return’][i-1] failed on the first iteration. I solved this by explicitly setting the first day’s return to 0 using df_portfolio[‘portfolio daily % return’][0] = 0 after the loop, and ensuring the loop started from index 1 rather than 0. This approach properly handled the edge case while maintaining accurate percentage calculations for all subsequent trading days.
What I learned
- Normalisation makes assets with very different price levels comparable before allocation weights are applied.
- Return without volatility is an incomplete description of portfolio performance, which is why the Sharpe ratio adds context.
- Time-series edge cases such as the first daily return need explicit handling rather than being allowed to propagate invalid values.
What I would improve next
- Compare random portfolios with an explicit optimisation objective and constraints.
- Use vectorised return calculations instead of chained assignment inside loops.
- Incorporate a clearly defined risk-free rate and transaction-cost assumptions when interpreting Sharpe ratios.
The project connects allocation choices to both absolute performance and risk-adjusted performance. That distinction is more useful than presenting portfolio growth without a measure of volatility.