Technical case study
Bank Customer Segmentation
I used K-Means clustering and PCA to turn high-dimensional credit-card behaviour into an interpretable customer-segmentation exercise.
The problem
Analyzed bank customer data to segment customers using K-Means Clustering, with dimensionality reduction achieved through PCA. This approach resulted in 7 well-defined customer segments based on key financial behaviors, optimizing the bank’s ability to market tailored products and services to their customers.
Can high-dimensional credit-card behaviour be reduced into useful customer groups without losing the structure that makes those groups meaningful?
Approach
Rather than presenting the project as a notebook dump, this case study focuses on the decisions that shaped the analysis.
- Load & inspect data: Loaded the dataset using pd.read_csv() , checked for nulls and reviewed data types using .info() and .describe() .
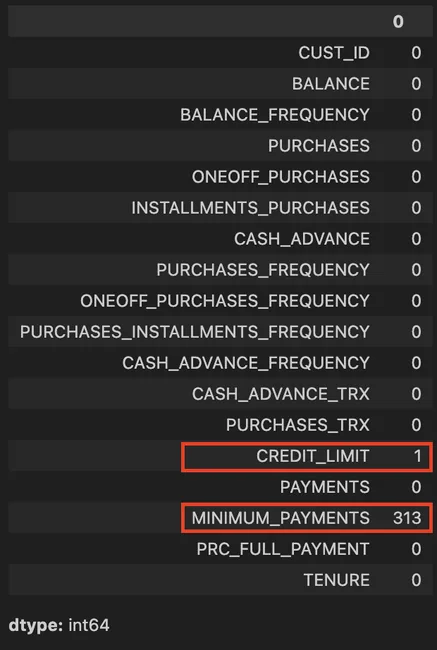
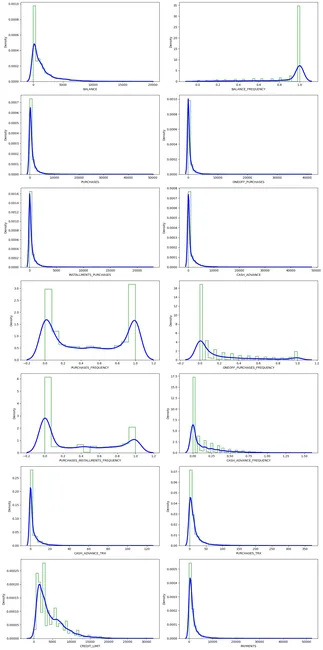
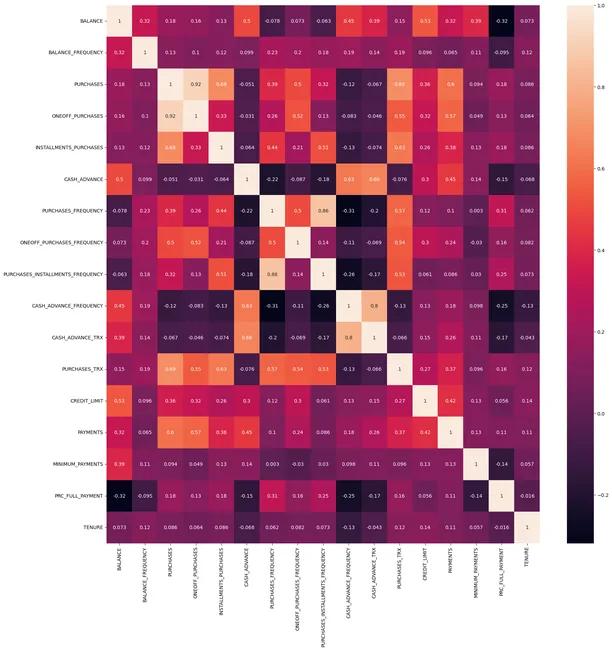
- Exploratory Analysis: Removed customer ID column. Handled missing values, especially in MINIMUM_PAYMENTS and CREDIT_LIMIT . Used pair plots and distribution plots to understand feature distributions and detect outliers.
- Feature selection & scaling: Selected numerical columns (like Age, Income, Spending Score) and scaled them using StandardScaler for optimal clustering.
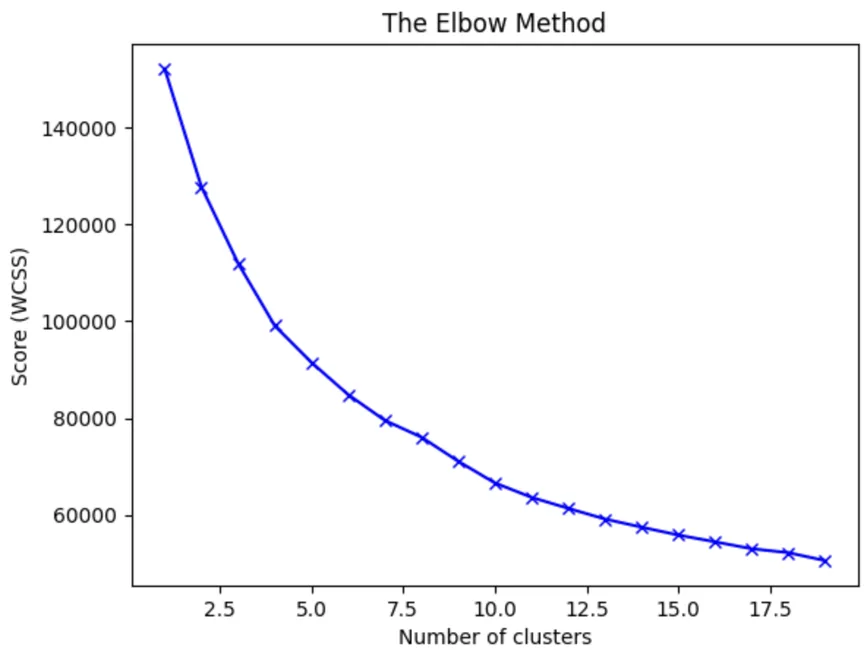
- Clustering with K-Means: Applied the Elbow Method to determine the optimal number of clusters and used KMeans to group customers.
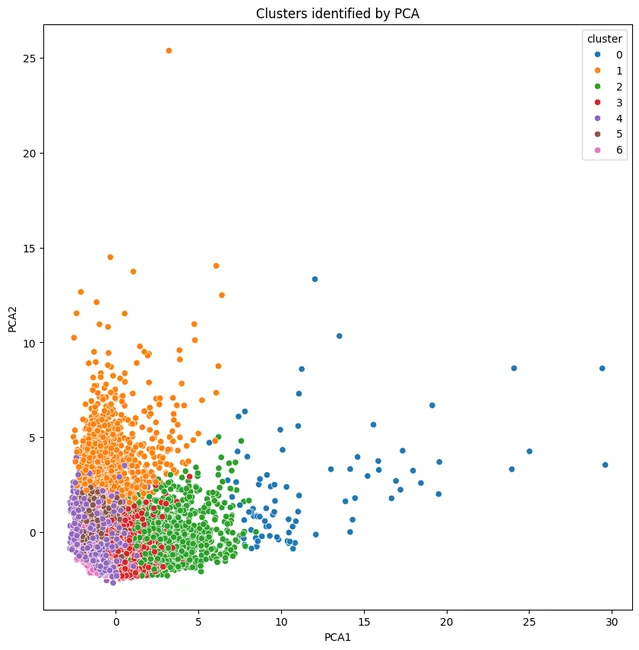
- Visualisation: Plotted clusters using PCA components. Created scatter plots with cluster labels to visualise customer groupings based on income and spending behaviour.
Key implementation decision
Scale first, cluster second, visualise last
K-Means is distance-based, so the raw financial features needed to be put on a comparable scale before clustering. PCA was then used as a visualisation layer rather than as a substitute for the clustering step.
scaler = StandardScaler()
credit_card_df_scaled = scaler.fit_transform(credit_card_df)

kmeans = KMeans(n_clusters=7, init="k-means++", random_state=42)
kmeans.fit(credit_card_df_scaled)
labels = kmeans.labels_

pca = PCA(n_components=2)
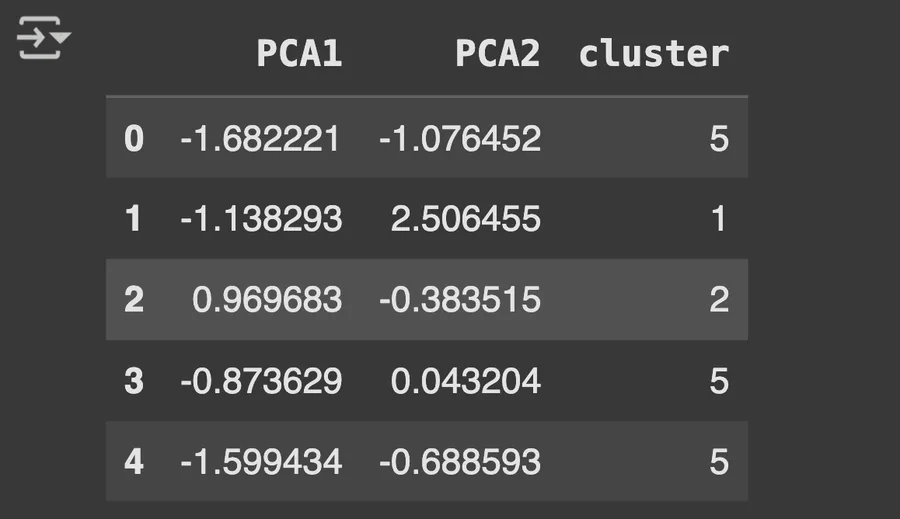
principalComp = pca.fit_transform(credit_card_df_scaled)Results & evidence
The figures below are the project evidence I would show first. The full implementation remains available through the GitHub link at the top of the page.

What challenged me
Initial visualisations of K-Means clusters were ambiguous due to the high dimensionality of features. Reducing dimensions with PCA made it easier to see meaningful separation, but it required balancing between retaining variance and simplifying complexity. I resolved this by examining explained variance ratios and adjusting the number of components accordingly.
What I learned
- Distance-based clustering is sensitive to feature scale, so standardisation belongs in the core method rather than as a cosmetic preprocessing step.
- PCA made the cluster structure easier to inspect, but visual separation should not be confused with proof that the chosen number of clusters is optimal.
- The useful output of segmentation is the behavioural profile of each group, not just the cluster label itself.
What I would improve next
- Validate cluster stability across different values of k and random seeds.
- Profile each cluster with summary statistics before attaching marketing interpretations.
- Compare PCA with another projection method while keeping K-Means evaluation separate from the visualisation.
The original dataset contains many behavioural variables on different numerical scales. The useful question was not only whether clusters could be generated, but whether their separation could be inspected and interpreted after dimensionality reduction.